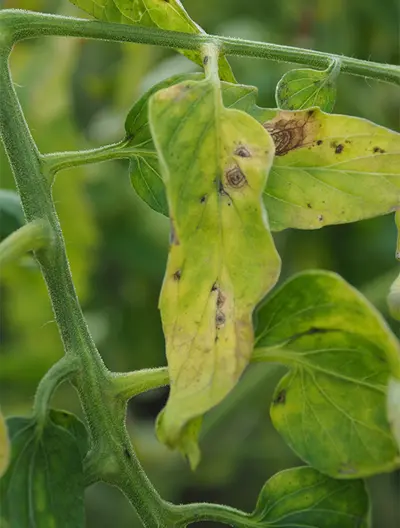
Fruit -Tomato "special Bacterial Spot disease"
Study Investigator: J. Curtis, Phd
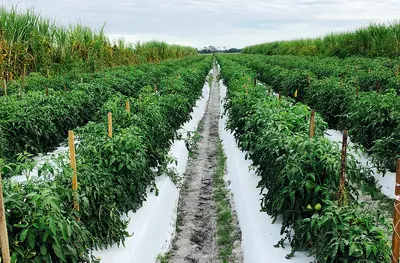
Location of Study: Florida, USA, open field
Study Period: April- July 2018

[T3,4,5] are the main Programs with VEGRO® considered in Open Field for this experiment
DAP: Number of Days After Precedent application
App 1
1 Pt/Acre from 1st flowers, (GS+Vegro®)
App 2
1 Pt/acre, 7 DAP
App 3
1 Pt/acre, 7 DAP
App 4
1 Pt/acre 7 DAP
App 5
1 Pt/Acre, 7 DAP
App 6
1 Pt/Acre, 7 DAP
App 7
1 Pt/Acre, 7 DAP
App 8
1 Pt/Acre, 7 DAP
[T6, T7] Programs with VEGRO® with special rate
DAP: Number of Days After Precedent application
App 1
1 Qt/Acre from 1st flowers, (GS+Vegro®)
App 2
1 Qt/acre, 7 DAP
App 3
1 Qt/acre, 7 DAP
App 4
1 Qt/acre 7 DAP
App 5
1 Qt/Acre, 7 DAP
App 6
1 Qt/Acre, 7 DAP
App 7
1 Qt/Acre, 7 DAP
App 8
1 Qt/Acre, 7 DAP
TREATMENTS
No fungicides were applied during this study. Plants were maintained at a commercial level with both insecticide (twice weekly applications) and fertilzer programs (liquid fertilizer through the drip every day). This is the grower standard and/or control.
Applied: A,B,C,D,E,F,G,H and replicated 4 times
..................................................................................................
Treatment 1 [T1]: Grower Standard AKA GS1
Applied: A,B,C,D,E,F,G,H and replicated 4 times
- • Untreated, nothing added to the GS
- • It corresponds to the GS1
..................................................................................................
Treatment 2 [T2], AKA GS2:
Applied: A,B,C,D,E,F,G,H and replicated 4 times
- • Grower Std [T1]
- • Manzate max @ 2 Qts/Acre
- • Kocide 2000 @ 3lb/Acre
- • Bravo Weatherstick @ 1.5 Pt/Acre
..................................................................................................
Treatment 3 [T3]:
Applied: A,B,C,D,E,F,G,H and replicated 4 times
- • Grower Std [T1]
- • Vegro @ 1 Pt per acre
Treatment 4 [T4]:
Applied: A,B,C,D,E,F,G and replicated 4 times
- • Grower Std [T1]
- • Manzate max @ 2 Qts/Acre
- • Kocide 2000 @ 3lb/Acre
- • Bravo Weatherstick @ 1.5 Pt/Acre
- • Vegro @ 1 Pt/Acre
..................................................................................................
Treatment 5 [T5]:
Applied: A,B,C,D,E,F,G,H and replicated 4 times
- • Grower Standard [T1]
- • Vegro @ 1 Pt/Acre
- • Manzate max @ 2 Qts/Acre
- • Kocide 2000 @ 3lb/Acre
- • Bravo Weatherstick @ 1.5 Pt/Acre
- • 0-28-26 @ 2 Qt/Acre
..................................................................................................
Treatment 6 [T6]:
Applied: A,B,C,D,E,F,G,H and replicated 4 times
- • Grower Standard [T1]
- • Vegro @ 1 Qt/Acre
..................................................................................................
Treatment 7 [T7]:
Applied: A,B,C,D,E,F,G,H and replicated 4 times
- • Grower Standard [T1]
- • Vegro @ 1 Qt/Acre
- • Bravo Weatherstik 1.5 Qt/acre
•••••••••••••••••••••••••••••••••••••••••••••••••••••••••••••••••••••••••••••••••••
APPLICATIONS
• Foliar Applications (Apps. A-H; Trts. 3-6).
• 8 (seven) total as: A,B,C,D,E,F,G,H
• Foliar applications were made on: 5/02/2018 (App. A), 5/09/2018 (App. B), 5/17/2018 (App. C), 5/24/2018 (App. D), 5/31/2018 (App. E), 6/08/2018 (App. F), 6/14/2018 (App. G), 6/21/2018 (App H).
• Foliar applications were made with a hand-held boom (CO2 operated, 40 PSI) fitted with three (3) nozzles (TXVS8) and sprayed at 63.9 GPA.
• Each side of the stacked tomato was sprayed with the boom (3 nozzles/row side).
• A separate spray mixture was prepared for each plot.
•••••••••••••••••••••••••••••••••••••••••••••••••••••••••••••••••••••••••••••••••••
EVALUATIONS:
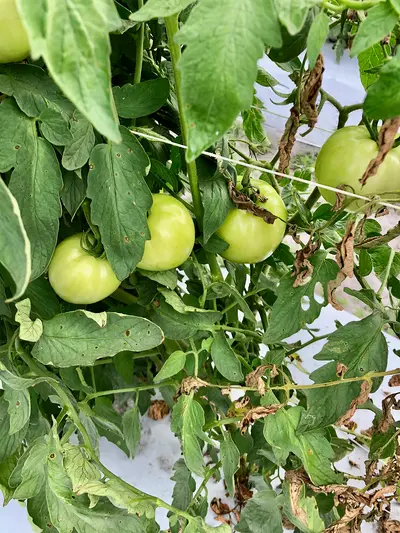
BACTERIAL SPOT DISEASE RATINGS
• The percentage (%) severity of bacterial spot (0% = no disease.....100% = dead plants) was evaluated on each plant/PLOT (22 plants/PLOT) on 6/11/2018, 6/25/2018 and 7/10/2018.
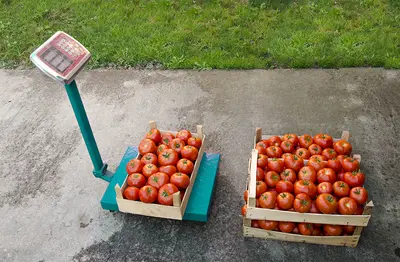
FRUIT COUNT & WEIGHT (lb)
• All fruit/PLOT were harvested from plots on 6/11/2018, 6/25/2018 and 7/10/2018
• Fruit were counted and weighed (lb).
• The total fruit count and weight were calculated on 7/10/2018.
•••••••••••••••••••••••••••••••••••••••••••••••••••••••••••••••••••••••••••••••••••
METHODOLOGY
FIELD AND PLANTING
• This trial was conducted at the Better Crops Research Farm: Block 7, Section N, Beds 1-9.
• Plastic beds (32 inch top, 6 inch tall) were prepared on a 6 ft row spacing.
• Tomato (cv. charger) were transplanted in one row/bed (1.5 ft plant spacing) on 4/12/2018.
• Plants were staked and tied (3 tie).
• Each plot was 35 ft in length x 1 bed (35 ft length x 6 ft width).
• Each treatment was replicated four (4) times.
• Treatments were arranged in Beds 2, 4, 6 and 8.
• These Treatment beds were separated by an untreated buffer row in Beds 1, 3, 5, 7 and 9.
• No fungicides were applied during this study.
• Plants were maintained at a commercial level with both insecticide (twice weekly applications) and fertilzer programs (liquid fertilizer through the drip every day).

Study Results
85.5%
[T1] Bacterial Spots' presence @ H4, untreated and with no Vegro®
71.3%
[T7] Bacterial Spots' presence @ H4 with Vegro® inside
-14.2%
[T7] Is the reduction rate in % for Bact. Spot Vs [T1]
-11.3%
[T6] Is the reduction rate in % for Bact. Spot Vs [T1]
+35.5%
[T7] Fruit count Vs [T1]
+17%
[T6] Fruit count Vs [T1]
+30.8%
[T7] More weight count Vs [T1]
+26.8%
[T6] More weight in Lb Vs [T1]
0%
Vegro® is zero Phytotoxicity
Objectives: To demonstrate the capacity of Vegro® to improve the efficacy of the fungicides at helping to reduce the Bacterial spots on Tomato and also to promote a more natural agriculture. Main parameters monitored for this study: Pressure disease (severity) and Yield (weight & fruit counts) .
For a better view of the graphs and charts, reposition your mobile device into landscape mode.
BACTERIAL SPOT REDUCTION (monitored by the degree of presence in %)
Higher are the bars, bad it is, and brownish colors are without any Vegro®'s presence and the opposite in greenish colors.
Rate of the infection by the Bacterial Spots in % at last harvest (H3):
- [T1] 85.5%; [T2] 84.2%; [T3] 88%; [T4] 82.3%; [T5] 76.8%; [T6] 74.2%; [T7] 71.3%
- -14.2% is the reduction of Bacterial spots when using [T7] Vs [T1]
- -11.3% is the reduction of Bacterial spots when using [T6] Vs [T1]
- Vegro® used at 1Pt/acre rate is not effective as shown on [T3] (Vegro® added to T1) Vs [T1]
This graph is about to demonstrate the efficacy of Vegro® to help at reducing the Bacterial Spot disease. It shows clearly that on that type of crop, the rate required for Vegro® is 1 Qt/Acre.
Fruit count (unit count) with [T7] it is +35.5% in comparison to [T1] and +17% with [T6]
[T7] compared to [T1] GS:
- +143.3 pieces count Vs [T1], means +35.5%
- +43 pieces count Vs [T6], means +8.5%
[T6] (Vegro® simply added to T1 but at 1 Qt/Acre) and in comparison to the Grower Std [T1]:
- +68.5 pieces count Vs [T1], means +17%
[T5] in comparison to the Grower Std [T1]:
- +100.3 pieces count Vs [T1], means +24.9%
It confirms here that there is a better quality fruit but same Vegro® require to be used at Minimum 1Qt/Acre.
Weight count (in Lb): +30.8% in [T7] Vs [T1] and +26.8% for [T6]
[T7] compared to [T1] GS:
- +29 Lb Vs [T1], means +30.8%
- +3.8 Lb Vs [T6], means +4%
[T6] (Vegro® simply added to T1 but at 1 Qt/Acre) and in comparison to the Grower Std [T1]:
- +25.2 Lb Vs [T1], means +26.8%
[T5] in comparison to the Grower Std [T1]:
- +21 Lb Vs [T1], means +22.3%
Vegro® confirmed the rate at 1 Qt/acre here and seems to perform better on that parameter. We can notice that [T6] is the 2nd best treatment after [T7]